

October Monthly Investment Update
Source: Blueprint Investment Partners
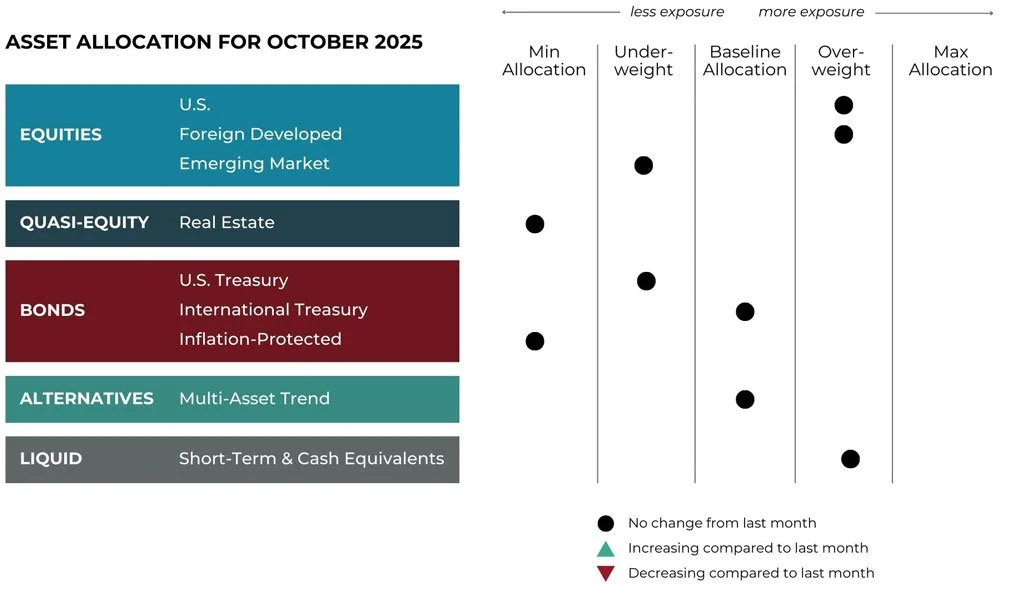
Adjustments can vary across strategies depending on each strategy's objectives. What's illustrated above most closely reflects allocation adjustments for the Growth Strategy. Diversification does not guarantee investment returns and does not eliminate the risk of loss. Diversification among investment options and asset classes may help to reduce overall volatility.
U.S. Equities
Exposure will not change and remain overweight. Both the intermediate- and long-term trends are positive.
International Equities
Overall exposure will not change and remain at baseline. Trends continue to be positive across all timeframes and tilted toward foreign developed equities given its relative strength.
Real Estate
Exposure will not change and remain at its minimum.
U.S. & International Treasuries
U.S. exposure will not change and remain underweight. Trends in the middle part of the U.S. Treasury yield curve are positive while the long-term end is negative. International Treasuries have weakened but are maintaining uptrends, and their overall allocation will remain at its baseline allocation.
Inflation-Protected Bonds
Exposure will be at its minimum. Trends are still positive but the group remains weak versus other fixed income assets.
Alternatives
Exposure is expressed through a multi-asset alternative ETF. Bonds (net long) continue to hold the most influential allocation, now followed by stocks (net long). Commodities remain slightly net long as well. The currency portfolio remains net short the U.S. Dollar.
Short-Term Fixed Income
Exposure will not change, having previously absorbed exposure from weaker, higher-duration bonds.
MONTLHY NOTE
Steady. But Ready.
“We suffer more often in imagination than in reality.” – Seneca
September has historically been a market weak spot, yet it has defied expectations. Instead of stumbling, stocks are pushing to new highs, volatility remains muted, and the seasonal trapdoor that investors often brace for has yet to appear.
That ongoing divergence from history highlights why we rely on process over prediction. Markets will often tempt investors with patterns, narratives, and gut instincts, but those don’t provide a consistent edge. A systematic investing approach does, in our view. It adapts to what’s actually happening — capturing strength while it lasts and cutting risk when conditions change — and it removes the guesswork that so often derails long-term plans.
In this month’s Note, we look at how markets navigated September’s supposed weakness, the potential catalysts that could bend trends from here, and why consistency is as important in strong markets as it is during downturns.
But first, here’s a summary of what transpired in the markets in September.
Asset-Level Overview
Equities & Real Estate
Despite September being the market’s weakest month on average — and the only one with a negative long-term return — the S&P 500 has so far delivered solid gains and reached new all-time highs. Price volatility continued to be low, which we have found to be highly correlated with favorable environments for positive performance in stocks. While things can change quickly, trends remain very positive and as a result our strategies will remain fully invested.
International stocks also enjoyed positive performance in September, approximately in line with the U.S. Emerging markets are running ahead of foreign developed, and both segments continue to experience uptrends. There will be no change to our fully invested status.
In a landscape of surging equities, real estate remains the weakest and within a sideways range. While the Fed’s benchmark rate just experienced its first decrease of 2025, mortgage rates remain mostly unchanged. With inflation and tariffs still providing some uncertainty, strongly positive trends have yet to materialize. The outcome of such trendless conditions will be a continued allocation at the minimum in this asset class, as our portfolios previously handed real estate exposure up to much-stronger U.S. equities.
Fixed Income & Alternatives
Bond instruments with intermediate to long duration generally moved higher over the last 30 days but remain relatively weak as the path of interest rates continues to be foggy. Perhaps more importantly, the risk/return tradeoff for these instruments is currently inferior to their short-term counterparts. The result is that exposure in our portfolios will not change, with intermediate bonds being underweight and long duration exposure being near zero.
Within the multi-asset trend alternatives bucket, short-term fixed income futures and other related instruments remain the most significant in terms of allocation. Exposure to longer-duration bonds remains primarily in short positions. Commodities, such as gold and cocoa, also make up noteworthy positions. Meanwhile, the continued strength in stocks globally has caused net long exposure to increase as well. The U.S. Dollar’s steady decline has caused this segment to increase allocations to foreign-denominated currencies.
Sourcing for this section: MarketWatch, “September is historically the worst month of the year for stocks. Why this time could be different.,” 9/1/2025; RBC Wealth Management, “Nothing new about September slides for stock markets,” 8/25/2025; and CNN, “Dow crosses 46,000: Stocks hit record highs as Wall Street embraces Fed rate cut hopes,” 9/11/2025
3 Potential Catalysts for Trend Changes
Slowing Business Growth:
A monthly indicator of activity in the manufacturing and services sectors decreased to 53.6 in September, down from 54.6 in August. This reading of the S&P Global Flash U.S. Composite PMI indicates overall business activity continued to expand, but the pace was the slowest in three months. “Although tariffs were again cited as a driver of higher input costs across both manufacturing and services, the number of companies able to hike selling prices to pass these costs on to customers has fallen, hinting at squeezed margins but boding well for inflation to moderate,” said Chris Williamson, an Economist at S&P Global.
Housing Freeze:
Home sales remain at historically low levels, and home prices have soared 52% since August 2019. However, home prices are declining compared to a year ago in many southern markets, particularly Florida and Texas. As for mortgage rates, they declined earlier in September to 11-month lows in advance of the Federal Reserve’s decision to cut short-term interest rates. Applications for mortgages rose a bit, as some rushed to take advantage of the decline. Although the Fed seems to be in cutting mode, mortgage rates may not fall fast. This is because the Fed sets a target for short-term, overnight interest rate – but mortgages are generally more associated with the longer-term yield on 10-year U.S. Treasuries (approximately the expected duration a homeowner might hold a 30-year mortgage before moving or refinancing).
Last Year’s Report Card:
Inflation ate into Americans’ wage gains in 2024, according to new Census Bureau data. This left most household incomes little changed, except for the richest ones. The data also show that average households have not gained economic ground since the COVID-19 pandemic, which underscores the continued toll of rising prices. Inflation-adjusted median household income last year was around $83,000, which is roughly the same level as in 2019, pre-pandemic 2020, after the sharp declines that followed COVID’s onset, and the tepid recovery since then. The only statistically significant change for 2024 was in incomes of high-earner households, which rose 4.2% in 2024. The report sheds new light on the state of the U.S. economy during the final year of the President Joe Biden administration. The economy has slowed considerably since then, and recent labor-market data shows several months of weak jobs growth.
Sourcing for this section: The Wall Street Journal, “U.S. Business Activity Growth Slows for Manufacturing, Services,” 9/23/2025; The Wall Street Journal, “Home Sales Fell in August, Slowed by High Home Prices,” 9/25/2025; The Wall Street Journal, “What Decides Where Mortgage Rates Go From Here,” 9/18/2025; and The Wall Street Journal, “Inflation Erased U.S. Income Gains Last Year,” 9/9/2025
What the Data Suggests For Q4
“In preparing for battle I have always found that plans are useless, but planning is indispensable.” – Dwight D. Eisenhower
Now that we have surpassed the seasonally poor performance of September, it is reasonable to start thinking about Q4 and where things go from here.
This year has been a mixed bag for sure:
High volatility in February
Between mid-February and early-April, the S&P 500 reached roughly a 20%+ decline (the mainstream definition of a bear market)
Low volatility driving markets to new all-time highs and double-digit returns through Q3
What the Data Suggests
According to an LPL Financial study, since 1950 when the S&P 500 has been up around 10% through September, Q4 has finished positive around 87% of the time, with an average gain of about 5%.
This level of performance surpasses the typical tendency of U.S. markets to increase.
With these findings in hand, we think investors should feel confident in the prevailing trends. Often, the right bet for those suitable for growth is to remain invested, in our opinion. Deviating from this approach in favor of a discretionary flight to safety would be a poor decision regardless of whether the outcome turned out to be correct...which brings us back to the benefits of a systematic investing approach.
Steady But Ready
We’ve always believed in the benefits of following systematic trends, and we don’t shy away from sharing why it can help you reach your goals. Our friends like to joke that we never miss an opportunity to do so, and they’re not wrong! It can be difficult to find mainstream commentary about any approach outside of passive investing. You might be able to find some interesting information about the benefits of a value approach, or perhaps the usefulness of incorporating alternatives or other fringe assets.
Amidst this lack of information, we feel it’s our responsibility to explain how systematic trend following can help you as an investor. It is our goal to provide resources that help you make informed decisions. Even in a year like 2025, when our strategies slightly trail their passive counterparts so far, we think a systematic investing approach has still added value for investors. For example, when markets were rapidly declining in March and April, our strategies had already reduced exposure. Had markets continued to decline, investors would have been protected. Just because the result ended up not being devastating doesn’t mean the decision to move defensive was poor, especially since our investing process allows us to quickly regain exposure when conditions reverse — which is what we did.
An analogy would be preparing for and reacting to an earthquake. Any one can be “the big one,” but just because the last one wasn’t doesn’t make it a bad decision to get under your desk.
Now, as 2025 heads into Q4, our strategies sit with a slightly lower absolute return, but lower volatility, lower drawdowns, and better risk-adjusted return. This is the crux of the value proposition we offer to investors.
In closing, while 2025 currently looks great and the data suggests odds are good it will continue, 2026 is just around the corner. And the picture is constantly evolving.
We often talk about how effective markets are at discounting future scenarios. Just as one thing is quickly priced in, the next item is being parsed by investors. For example, it is possible ALL potential upcoming rate cuts have been priced in and markets are on the verge of pricing in whatever comes next. In our view, our strategies have proven they are ready. If you are not partnering with us, have yours?
Sourcing for this section: Barchart.com, S&P 500 Index ($SPX), 2/19/2025 to 4/7/2025 and LPL Financial, “What Can Year-to-Date Gains Tell Us About the Fourth Quarter?,” 9/24/2025
Important Information:
Blueprint Financial Advisors d/b/a Miller Wealth Partners is an investment adviser registered under the Investment Advisers Act of 1940. Registration as an investment adviser does not imply any level of skill or training. For more information, please visit adviserinfo.sec.gov and search for our firm name. All content available on this website is general in nature, not directed or tailored to any particular person, and is for informational purposes only. Neither the website nor any of its content is offered as investment advice and should not be deemed as investment advice or a recommendation to purchase or sell any specific security or of any particular strategy or investment product. Blueprint does not represent that any opinion or projection will be realized. Neither Blueprint nor any of its advisers, officers, directors, or affiliates represents that the information presented on this website is accurate, current or complete, and such information is subject to change without notice. Past performance is not a guarantee of future results. Neither this website nor its contents should be construed as legal, tax, or other advice. Individuals are urged to consult with their own tax or legal advisers before entering into any advisory contract.
Past performance is not indicative of future results. The material above has been provided for informational purposes only and is not intended as legal or investment advice or a recommendation of any particular security or strategy. The investment strategy and themes discussed herein may be unsuitable for investors depending on their specific investment objectives and financial situation.
Opinions expressed in this commentary reflect subjective judgments of the author based on conditions at the time of writing and are subject to change without notice. The above commentary is for informational purposes only. Not intended as legal or investment advice or a recommendation of any particular security or strategy.
Information obtained from third-party sources is believed to be reliable though its accuracy is not guaranteed.
No part of this material may be reproduced in any form, or referred to in any other publication, without express written permission from Miller Wealth Partners.
An index is an unmanaged portfolio of specific securities. The performance of which is often used as a benchmark in judging the relative performance of certain asset classes. It should not be assumed that past performance in any way relates to future results. An investment cannot be made directly in an index. An index does not charge management fees or brokerage expenses, and no such fees or expenses were deducted from the performance shown.
S&P 500 Index: A widely used U.S. equity benchmark. It contains 500 U.S. stocks chosen for market size, liquidity, and industry group representation.
S&P Global Flash U.S. Composite Purchasing Managers’ (PMI) Index: A monthly index that gauges private-business activity in the US manufacturing and services sectors