

July 2026 Monthly Investment Update
Source: Blueprint Investment Partners
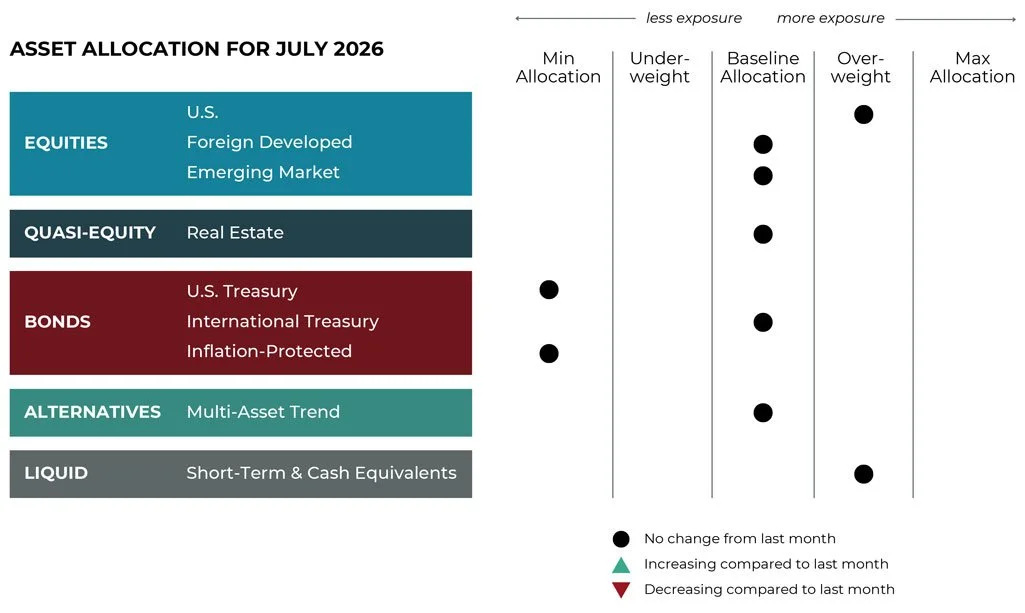
Adjustments can vary across strategies depending on each strategy's objectives. What's illustrated above most closely reflects allocation adjustments for the Growth Strategy. Diversification does not guarantee investment returns and does not eliminate the risk of loss. Diversification among investment options and asset classes may help to reduce overall volatility.
U.S. Equities
Exposure will not change and remain overweight. Both the intermediate-term and long-term trends are positive.
International Equities
Exposure will not change and remain at baseline. Both foreign developed and emerging market equities have intermediate- and long-term uptrends.
Real Estate
Exposure will remain at its baseline allocation as trends over both timeframes remain positive.
U.S. & International Treasuries
International Treasuries are now being partially expressed with an adaptive fixed income ETF. This will allow for continued baseline exposure and offer the ability to potentially benefit from both positive and negative trends. U.S. Treasuries of medium to long duration remain in downtrends across all timeframes and will continue to be underweight.
Inflation-Protected Bonds
Exposure will remain at its minimum with downtrends across both timeframes.
Alternatives
Exposure is expressed through a multi-asset alternative ETF. Fixed income continues to have the largest net exposure (short prices, long rates), followed by net long equities. International currencies will slightly surpass commodities for third- and fourth-greatest exposure respectively, with both continuing to be net long.
Short-Term Fixed Income
Exposure will not change and be overweight, as this asset class continues to hold allocations from weaker fixed-income instruments.
MONTLHY NOTE
How to Navigate the Space Between: Evidence & Uncertainty
“Uncertainty is an uncomfortable position. But certainty is an absurd one.”
– Voltaire
Certainty has a way of sometimes working against investors in both directions.
When markets are falling, it shows up as conviction that losses will continue. When markets are rising, it can reappear as confidence that gains have gone too far, that a correction is overdue, or that strength itself is a warning sign.
June offered a useful illustration. Equity markets softened during the month, but the broader second quarter remained exceptionally strong. That combination tends to produce discomfort. The data points to a constructive market environment, while instinct often argues for caution.
This month’s Note examines previous periods of unusually strong quarterly equity returns, what tended to happen afterward, and why strong markets have often deserved more respect than investors are inclined to give them. It also explores why a systematic investing process can help with navigating the space between evidence and uncertainty.
But first, here’s a summary of what transpired in the markets in June.
Asset-Level Overview
Equities & Real Estate
Despite progress in the Middle East, including a reported agreement on a ceasefire that would reopen the Strait of Hormuz, markets remain volatile as June comes to a close. After making new all-time highs on June 1 and 2, the S&P 500 Index fell, finishing the month in the red. As we discuss further below, despite the decline in June, the S&P 500 enjoyed one of its best quarters in more than 30 years.
While AI firms mostly declined in June and dragged down the S&P 500, the Nasdaq, other growth indexes, and other equity indexes managed to rise. Most notably, mid- and small-caps stocks are on pace to increase for the month, extending their lead on their large-cap counterparts for 2026. Value stocks are also set to close higher for the month and continue to outperform.
International equities appear on target for a decrease in June, but to a lesser extent than U.S. large-cap equities. For the year, these segments remain ahead of the U.S. Despite the decline for June, trends are positive and thus our portfolios will continue to be fully invested.
Real estate securities are on pace to rise in June despite all the talk of inflation and higher interest rates. In fact, depending on your vantage point and mix of securities, some real estate indexes are making multi-year highs as the second quarter winds down. Our portfolios remain fully invested in these rising trends.
Fixed Income & Alternatives
While real estate securities managed to navigate rate pressure seemingly well in June and throughout the second quarter as a whole, fixed income instruments have not been so fortunate. Though generally flat in June, the second quarter as a whole has been a bust, dropping most bond segments into the red for the year so far. The result from a trend perspective is that our portfolios will remain minimally exposed, favoring ultra-short-duration instruments that are less susceptible to rising interest rates.
Within the alternatives allocation there is no directional change. Fixed income continues to be net short while equities, commodities, and currencies remain net long. While none of the macro exposures have shifted, there have been some gradual changes in commodities. For example, metals and grains have declined, the long position in metals has been reduced, and the net short in grains is increasing. The surge in the U.S. Dollar has also caused the allocation to foreign currencies to decrease.
Sourcing in this section: cnbc.com, “S&P 500 closes at a record to kick off June trading as tech rally overpowers oil spike: Live updates,” 6/1/2026 and cnbc.com, “Dow jumps more than 200 points, S&P 500 posts first close above 7,600: Live updates,” 6/2/2026
3 Potential Catalysts for Trend Changes
Prices:
The Fed’s preferred measure of monthly price increases kept rising in May. The personal-consumption expenditures (PCE) price index rose 0.4% in May, the same as in April. During the past year, the PCE index increased by 4.1%, which is the highest since April 2023 and more than twice the Federal Reserve's target. The core 12-month PCE inflation rate is now 3.4%. PCE readings are usually close to economists' expectations because the subject-matter experts can use earlier-released consumer and producer price data to inform their forecasts.
Consumers:
Consumer sentiment improved in June as gasoline prices eased. The Michigan consumer-sentiment index rose to 49.5 in June, up from 44.8 in May. Expectations for business conditions over the next five years jumped 16%, as concerns about the long-term effects of the Iran conflict started to fade. Still, sentiment is 13% lower than it was in February 2026, before the conflict in Iran began. Consumer sentiment has been slowly recovering from record lows, helped by news of a ceasefire and lower gasoline prices. Some economists think this could mark the peak of the inflation surge linked to the conflict in Iran. Meanwhile, long-term inflation expectations dropped to 3.3% in June from 3.9% in May, according to the survey. Economists and Federal Reserve officials monitor these expectations closely to ensure price pressures do not become self-fulfilling. Other market-based measures of inflation expectations have stayed steady.
Earnings:
Rising gasoline prices have wiped out more than a year of wage gains for Americans. In May, consumer prices rose 4.2% from a year earlier, much higher than the 3.4% rise in average hourly earnings. This means inflation-adjusted earnings fell 0.7% from a year ago, the largest drop since February 2023. May was the second-straight month that inflation outpaced earnings growth, mainly because of higher fuel prices after the U.S. and Israel attacked Iran at the end of February. Wage growth has also slowed, making it harder for workers to keep up with rising costs. As a result, Americans’ inflation-adjusted earnings have dropped back to their January 2025 level, when President Donald Trump returned to office. In June, Americans have seen some relief: regular gasoline’s average at one point was $4.15 a gallon, according to AAA, down from May’s average of $4.49. Still, that is much higher than the $3.12 average a year ago, so inflation-adjusted earnings in June may still lag behind last year’s levels.
Sourcing for this section: The Wall Street Journal, “Fed’s Preferred Inflation Gauge Climbs Above Target Range,” 6/25/2026; The Wall Street Journal, “Consumer Sentiment Improves in June as Gasoline Prices Moderate,” 6/26/2026; and The Wall Street Journal, “Gas Prices Wipe Out More Than a Year of Wage Gains,” 6/10/2026
Favorable Probabilities Paired with Unavoidable Uncertainty
“Far more money has been lost by investors preparing for corrections, or trying to anticipate corrections, than has been lost in corrections themselves.”
– Peter Lynch
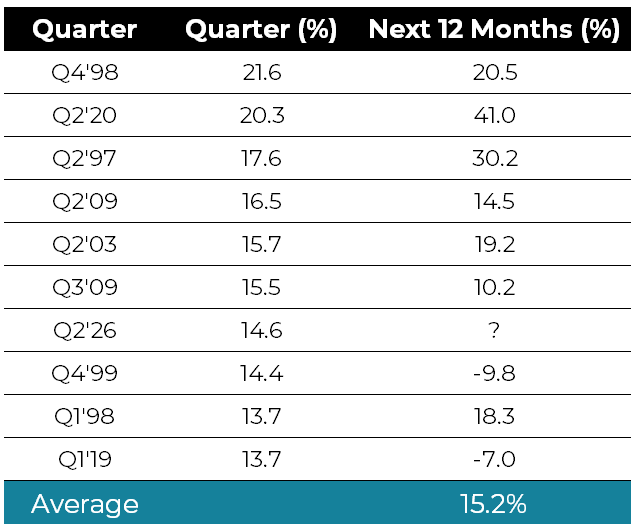
Despite June’s decline, the second quarter of 2026 delivered one of the strongest bursts of equity performance investors have experienced in decades. Through June 29, the S&P 500 (as measured by ETF ticker SPY) gained approximately 14.6% during the quarter, making it the seventh-best calendar quarter since the ETF's inception in 1993.
That statistic alone is remarkable. During more than 30 years of market history, only six calendar quarters have produced stronger returns. What's perhaps even more interesting is what happened next in prior instances.
Looking at the nine completed occurrences among the top ten quarters, the average subsequent 12-month return was approximately 15.2%, notably higher than the market's long-term average return. In other words, history suggests that exceptionally strong quarters have often been followed by additional gains rather than immediate reversals.
Top 10 Quarters For the S&P 500
Source: ICE, State Street SPDR S&P 500 ETF Trust (SPY), 1/1/1993 to 6/29/2026
At first glance, this may seem counterintuitive. Investors are naturally inclined to believe that a powerful rally leaves markets "overbought" and due for a pullback. Yet markets rarely operate according to intuition. Strong performance is often evidence of improving fundamentals, increasing investor confidence, and persistent momentum — all characteristics that can sustain trends for longer than many expect.
Today's market environment certainly feels supportive of that possibility. Economic growth remains resilient, corporate earnings have generally exceeded expectations, and fears that dominated headlines have repeatedly faded into the background. The market's ability to recover from periods of uncertainty and rapidly return to new highs is a reminder that the primary trend remains intact.
However, history also provides an important warning.
Among the previous top-ten calendar quarters, two stand out as cautionary tales:
1. The fourth quarter of 1999 was followed by a nearly 10% decline over the next year, as the Dot Com Bubble began to unwind.
2. Similarly, the first quarter of 2019 was followed by a negative 12-month return, as the COVID-19 shock unexpectedly disrupted global markets.
These two periods serve as a reminder that while strong returns often lead to further gains, they do not guarantee them. Markets are complex systems influenced by countless variables, many of which are unknowable in advance. Few investors in late 1999 anticipated the magnitude of the technology collapse that would follow. Likewise, almost no one entered 2020 forecasting a global pandemic.
This uncertainty is one of the primary reasons we continue to emphasize a systematic trend-following approach. Trend following does not require us to predict whether the future will resemble the average outcome or one of the historical outliers. It simply asks us to observe what markets are actually doing and respond accordingly. When trends are positive, as they are today across many asset classes, the strategy seeks participation. When trends weaken or reverse, risk can be reduced without needing to identify the catalyst ahead of time.
The lesson from history is not that markets are destined to rise from here. Rather, it is that strong market environments have historically deserved respect. Investors who exited simply because prices had already risen often missed substantial additional gains. At the same time, history reminds us that exceptional periods occasionally precede significant disruptions that nobody sees coming.
That combination — favorable probabilities paired with unavoidable uncertainty — is where trend following can provide value. The historical data suggests the path of least resistance may continue to be higher. But should this period ultimately prove to be one of the rare exceptions, a disciplined risk-management process may become far more important than any forecast.
As we move into the second half of the year, we remain focused not on predicting what markets should do, but on objectively following what they are actually doing. For now, the evidence remains constructive. And until the trends change, we believe they deserve the benefit of the doubt.
Sourcing for this section: ICE, State Street SPDR S&P 500 ETF Trust (SPY), 1/1/1993 to 6/29/2026
Important Information:
Past performance is not indicative of future results. The material above has been provided for informational purposes only and is not intended as legal, tax, or investment advice or a recommendation of any particular security or strategy or of any particular strategy or investment product. The investment strategy and themes discussed herein may be unsuitable for investors depending on their specific investment objectives and financial situation.
Opinions expressed in this commentary reflect subjective judgments of the author based on conditions at the time of writing and are subject to change without notice. The above commentary is for informational and educational purposes only and should not be construed as investment advice or a recommendation to buy or sell any security. Not intended as legal or investment advice or a recommendation of any particular security or strategy.
Information obtained from third-party sources is believed to be reliable though its accuracy is not guaranteed.
No part of this material may be reproduced in any form, or referred to in any other publication, without express written permission from Miller Wealth Partners.
An index is an unmanaged portfolio of specific securities. The performance of which is often used as a benchmark in judging the relative performance of certain asset classes. It should not be assumed that past performance in any way relates to future results. An investment cannot be made directly in an index. An index does not charge management fees or brokerage expenses, and no such fees or expenses were deducted from the performance shown.
Michigan Consumer-Sentiment Index: Measures consumer confidence through monthly surveys conducted by the University of Michigan. Results include insights on personal finances, business conditions, and future buying decisions.
Nasdaq Composite Index: A market capitalization-weighted index of more than 2,500 stocks listed on the Nasdaq stock exchange. It is a broad index that is heavily weighted toward the important technology sector.
Personal Consumption Expenditures (PCE) Price Index: A measure of the prices that people living in the U.S., or those buying on their behalf, pay for goods and services. The change in the PCE price index is known for capturing inflation (or deflation) across a wide range of consumer expenses and reflecting changes in consumer behavior.
S&P 500 Index: A widely used U.S. equity benchmark. It contains 500 U.S. stocks chosen for market size, liquidity, and industry group representation.